November 10, 2026 | By Mr. Coin
Bitcoin has had a difficult start to November 2026. After briefly closing above $80,000, the cryptocurrency has slipped back toward the $75,000 level. Meanwhile, substantial outflows from US spot Bitcoin exchange-traded products (ETPs) have added another factor for market observers to consider.
Attention is also turning to the latest US inflation report, scheduled for release on November 10. The report could provide new information about the broader economic environment and expectations for Federal Reserve interest rate policy.
These developments offer a useful picture of the current Bitcoin market, although none should be viewed as a reliable indicator of where prices will move next.
Bitcoin Price Falls Below $80,000
Bitcoin’s recent price performance shows how quickly market conditions can change.
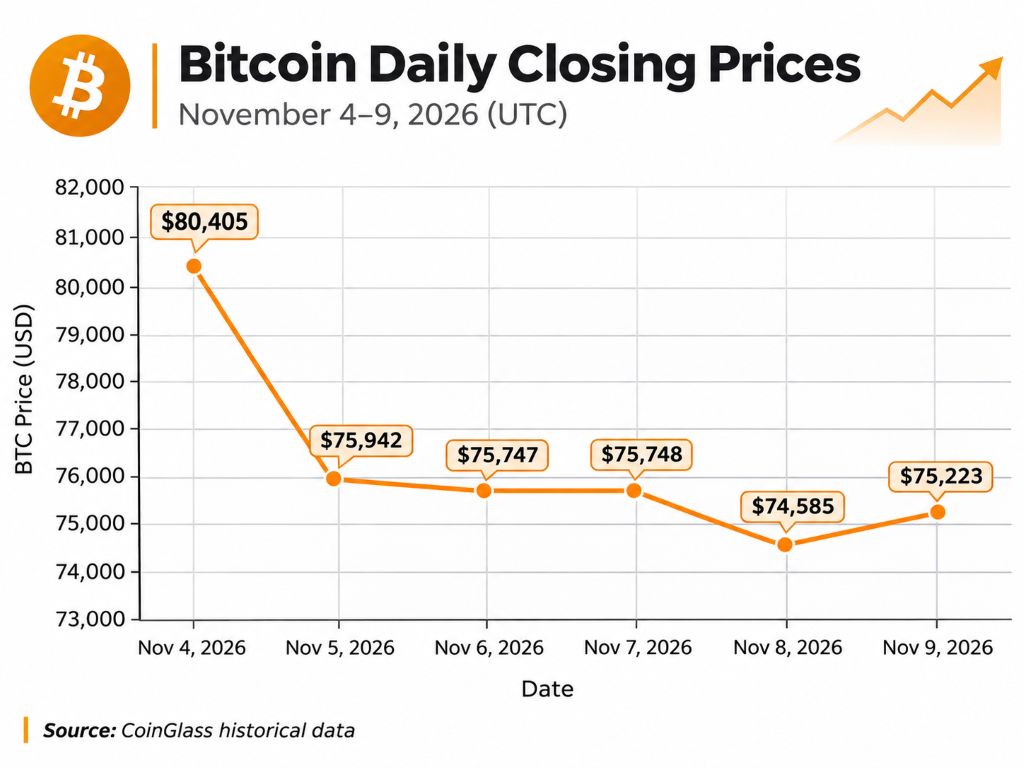
According to historical data from CoinGlass, Bitcoin closed at approximately $80,405 on November 4, 2026. By November 9, its closing price had fallen to around $75,223.
That represents a decline of approximately 6.45% over five days.
The table below summarizes Bitcoin’s daily closing prices during this period.
| Date (UTC) | BTC Closing Price (USD) |
|---|---|
| November 4, 2026 | $80,405 |
| November 5, 2026 | $75,942 |
| November 6, 2026 | $75,747 |
| November 7, 2026 | $75,748 |
| November 8, 2026 | $74,585 |
| November 9, 2026 | $75,223 |
Source: CoinGlass, Bitcoin Historical Data. Figures are rounded to the nearest dollar. Daily periods follow UTC.
The most noticeable decline occurred on November 5, when Bitcoin lost approximately 5.55% in a single day.
Prices remained relatively stable over the following two days before dropping again on November 8. Bitcoin then recorded a modest recovery on November 9, but its closing price remained well below the November 4 level.
This pattern illustrates Bitcoin’s volatility. Prices can move significantly over a short period, and a recovery on one day does not necessarily establish a sustained upward trend.
It is also worth remembering that Bitcoin trades around the clock. Unlike traditional stock markets, cryptocurrency trading continues through weekends and public holidays.
US Spot Bitcoin ETFs Record Significant Outflows
Another development worth watching is the flow of funds through US spot Bitcoin exchange-traded products, commonly referred to as spot Bitcoin ETFs.
These products allow investors to gain exposure to Bitcoin’s price through securities traded on traditional exchanges, without having to purchase or manage Bitcoin directly.
According to Farside Investors, US spot Bitcoin ETFs experienced approximately $1.28 billion in net outflows during the five trading sessions from November 2 to November 6, 2026.
Here is the daily breakdown.
| Date | Net ETF Flows (USD Million) |
|---|---|
| November 2, 2026 | −$398.6 |
| November 3, 2026 | −$115.6 |
| November 4, 2026 | +$74.6 |
| November 5, 2026 | −$430.2 |
| November 6, 2026 | −$411.9 |
| Total | −$1,281.7 |
Source: Farside Investors. Negative values indicate net outflows, while positive values indicate net inflows. Figures are based on US trading dates.
Four of the five sessions recorded net outflows, with November 5 showing the largest daily withdrawal at approximately $430.2 million.
The negative trend also appeared to continue into the following week. At the time of this review, Farside Investors showed approximately $201 million in net outflows for November 9, although the more recent figure may still be subject to revision.
What Do ETF Outflows Tell Us?
Put simply, net outflows mean that redemptions exceeded new share creations across the tracked products during a particular period.
This provides a useful indication of activity in the exchange-traded Bitcoin investment market. However, it does not represent all Bitcoin buying and selling.
Bitcoin is traded through cryptocurrency exchanges, derivatives markets, over-the-counter transactions, and other channels worldwide.
ETF flows also reflect activity from different types of investors, not exclusively large financial institutions.
For that reason, it would be misleading to conclude that ETF outflows alone caused Bitcoin’s recent price decline. They are one part of a much larger market.
US Inflation Data Takes Center Stage
Alongside developments in the cryptocurrency market, investors are preparing for another important economic announcement.
The US Bureau of Labor Statistics (BLS) is scheduled to publish the Consumer Price Index (CPI) report for October 2026 on November 10, 2026, at 8:30 a.m. Eastern Standard Time (13:30 UTC).
At the time this article was prepared, the report had not yet been released.
The CPI measures changes in the prices consumers pay for goods and services. It is one of the most widely followed indicators of inflation in the United States.
Although Bitcoin operates independently of central banks, the market for Bitcoin is not isolated from broader financial conditions.
Why Does US Inflation Matter for Bitcoin?
Inflation data can influence expectations about the Federal Reserve’s monetary policy.
If inflation remains elevated, the Federal Reserve may have less room to reduce interest rates. If inflation slows, it could support expectations for a more accommodative policy, depending on employment conditions and other economic indicators.
Interest rate expectations can affect borrowing costs, financial liquidity, and investor appetite for assets considered relatively risky.
Bitcoin may be affected by these changes, particularly as cryptocurrency markets have become increasingly connected with traditional financial markets.
Still, the relationship is not straightforward.
Lower inflation does not automatically mean Bitcoin prices will rise. Similarly, higher inflation does not guarantee a decline.
Market reactions also depend on how actual economic data compares with expectations, along with other developments taking place at the same time.
What Does This Mean for the Bitcoin Market?
Looking at the available information, three developments stand out.
First, Bitcoin has struggled to recover its early-November price level. The decline from approximately $80,405 on November 4 to $75,223 on November 9 reflects a period of considerable price volatility.
Second, the US spot Bitcoin ETF market has experienced substantial net outflows. These figures suggest that redemptions have been exceeding new share creations across the products tracked by Farside Investors.
Third, the upcoming US inflation report could offer further insight into the economic environment influencing financial markets.
Each indicator provides a different perspective.
Bitcoin prices show how the asset’s market value is changing. ETF flows help describe activity within a specific investment channel. Inflation data, meanwhile, provides information about wider economic conditions.
Taken together, these indicators offer a more balanced understanding of the market than relying on daily price movements alone.
For now, the available data points to a Bitcoin market experiencing notable volatility, negative ETF flows, and continued attention to macroeconomic developments.
The next meaningful assessment will depend on updated market data and the actual inflation figures once published.
Understanding the Market: A Few Useful Terms
Some financial terms appear frequently in Bitcoin market reports. Understanding them can make market news easier to follow.
1. Spot Bitcoin ETF
A spot Bitcoin ETF is the commonly used name for an exchange-traded investment product that holds Bitcoin and seeks to track its price.
Investors buy and sell shares of the product on a traditional securities exchange rather than managing Bitcoin directly in a cryptocurrency wallet.
In the United States, these spot Bitcoin products are generally structured as exchange-traded commodity trusts. Technically, they are ETPs rather than ETFs registered under the Investment Company Act of 1940.
2. Net Inflows and Net Outflows
Net inflows occur when more capital enters an investment product through new share creations than leaves through redemptions during a reporting period.
Net outflows describe the opposite situation.
These figures help readers understand fund activity, but they should not be confused with the total trading volume of Bitcoin.
3. Consumer Price Index (CPI)
The CPI measures changes over time in the prices paid by consumers for a representative range of goods and services.
It is frequently used to monitor inflation and is closely followed by economists, policymakers, and financial market participants.
4. Market Volatility
Volatility describes the extent to which an asset’s price changes over time.
An asset with high volatility can experience large price movements within relatively short periods.
Bitcoin is known for significant price fluctuations, making volatility an important consideration when interpreting its market performance.
Sources and References
- CoinGlass — Bitcoin Historical Price Data, 2026 — Historical Bitcoin prices and daily closing data.
- Farside Investors — Bitcoin ETF Flows — Daily net inflows and outflows for US spot Bitcoin exchange-traded products.
- US Bureau of Labor Statistics — November 2026 Release Schedule — Official release schedule for the October 2026 Consumer Price Index report.
- US Bureau of Labor Statistics — Consumer Price Index — Background information and official CPI data.
- US Securities and Exchange Commission — Exchange-Traded Products Providing Exposure to Bitcoin and Ether — Regulatory explanation of spot Bitcoin ETPs and their associated risks.
Data note: This article reflects information reviewed on November 10, 2026, before the scheduled US CPI release at 13:30 UTC. Bitcoin daily closing prices are based on UTC, while ETF flow dates refer to US trading sessions. Figures may be revised by their respective data providers.
Disclaimer: This article is intended for informational and educational purposes only. It does not constitute financial or investment advice. Cryptocurrency markets are volatile and involve financial risks.